The Kellogg Soil Survey Laboratory (KSSL) spectral library contains over 50,000 soil samples, each with matched Visible-Near Infrared-Shortwave Infrared (Vis-NIR-SWIR) reflectance spectra and detailed laboratory chemistry measurements. It represents the largest publicly available soil spectral dataset globally, yet its potential remains largely untapped by most remote sensing projects outside federal programs.
This library serves as a critical ground-truth resource for calibrating and validating remote sensing models aimed at predicting soil properties. Reflectance spectroscopy measures how soil samples absorb and reflect light across specific wavelengths. Each soil constituent, from organic carbon to clay minerals, possesses a unique spectral signature. Soil organic carbon (SOC), for instance, exhibits distinct absorption features in the Vis-NIR range, making it detectable through spectral analysis. Lab instruments measure this reflectance from dried, ground soil samples, and these KSSL data, housed within the KSSL laboratory database, are paired with traditional wet chemistry results for properties like organic carbon content, cation exchange capacity, and particle size distribution.
What the Data Shows
Consider the Corn Belt, where bare soil Vis-NIR-SWIR reflectance accurately predicts soil organic carbon with R-squared values ranging from 0.75 to 0.88. This strong statistical relationship confirms that the reflectance-carbon correlation holds across diverse soil texture classes, provided models are calibrated using geographically matched training samples from libraries like KSSL.
For carbon project developers, the KSSL spectral library offers a pathway to more scalable and cost-effective monitoring, reporting, and verification (MRV) for carbon credit generation. Accurate quantification of soil carbon stocks, validated against KSSL-derived models, is fundamental for securing credit integrity and market trust. Instead of relying solely on extensive traditional lab sampling, spectral models reduce costs and increase monitoring frequency, accelerating project development and reducing financial risk. A different application arises in precision agriculture. Firms can integrate these spectral insights with high-resolution multispectral drone imagery. This allows for detailed intra-field mapping of soil organic matter, guiding variable-rate fertilizer applications and optimizing input use, directly impacting farm profitability and environmental stewardship.
Soil Carbon Prediction Accuracy — Spectral vs. Traditional Methods
| State / Region | R² — SOC Prediction |
|---|---|
| UAV Multispectral (5cm) | 0.87% |
| Vis-NIR-SWIR Lab Scan | 0.84% |
| Sentinel-2 Bare Soil | 0.71% |
| Landsat Composite | 0.63% |
| Field Morphology | 0.55% |
| Grid Sampling | 0.48% |
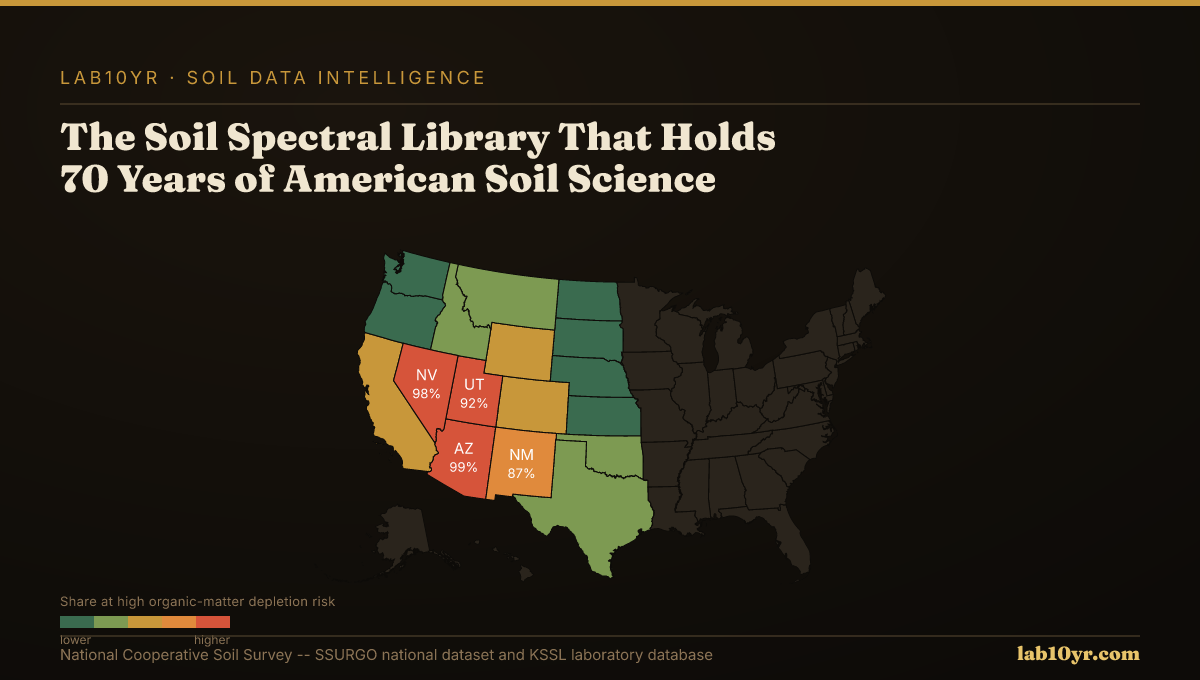
The Regional Picture
We analyze and interpret remote sensing data by using the KSSL library for model training and validation. By compositing multi-year satellite imagery, such as from Landsat, stable bare soil spectral signals can be extracted, filtering out transient vegetation and atmospheric noise. These signals, calibrated against KSSL reference data, enable regional soil organic matter mapping at 30-meter resolution. For finer detail, multispectral drone imagery at 5-cm resolution from bare soil composites can predict soil organic matter with R-squared values between 0.82 and 0.87, outperforming broader satellite products for field-specific insights. These remote sensing outputs are integrated with baseline soil properties from the SSURGO database, accessible via Soil Data Access, using tables like `chkey` and `coclass` to link spectral predictions to established soil series and their characteristics. This combination provides a holistic view of soil quality.
The KSSL spectral library is not merely a collection of data; it is an essential calibration standard for advancing remote sensing applications in soil science. It bridges the gap between field-level chemistry and orbital observations, providing the critical ground truth needed for accurate, scalable soil intelligence.
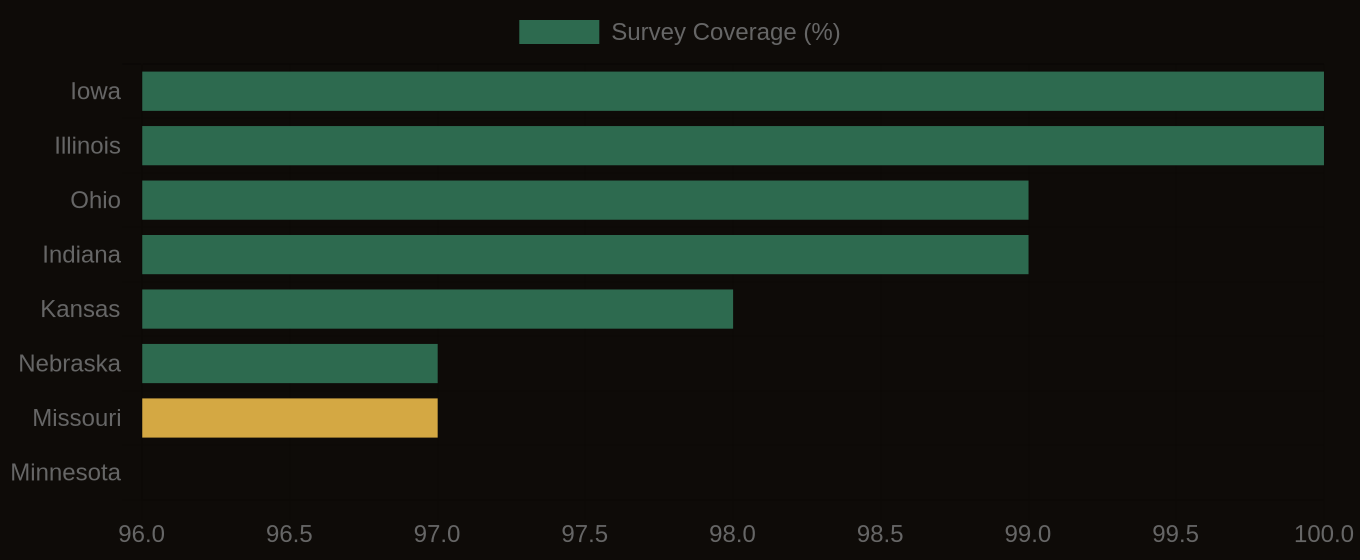
SSURGO Data Coverage — National Survey Completeness