The Kellogg Soil Survey Laboratory spectral library contains over 50,000 soil samples with matched Vis-NIR-SWIR reflectance and laboratory chemistry measurements. It is the largest public soil spectral dataset in the world. Most remote sensing projects outside federal programs have never heard of it, representing a substantial missed opportunity for calibration and validation. This extensive archive holds the key to more accurate remote sensing interpretations of critical soil properties, particularly soil organic carbon.
Reflectance spectroscopy in the Visible, Near-Infrared, and Shortwave Infrared (Vis-NIR-SWIR) regions measures how different wavelengths of light interact with soil constituents. When light strikes a soil sample, some wavelengths are absorbed, and others are reflected. Soil organic carbon, clay minerals, and water content each exhibit distinct absorption features across the electromagnetic spectrum, creating a unique spectral fingerprint for a given soil. The Kellogg Soil Survey Laboratory (KSSL) meticulously measures these reflectance signatures using laboratory spectrometers and correlates them with detailed wet chemistry analyses for each sample.
What the Data Shows
This direct linkage between spectral data and measured chemistry is invaluable for remote sensing applications. For instance, bare soil Vis-NIR-SWIR reflectance predicts soil organic carbon with R-squared values ranging from 0.75 to 0.88 in the Corn Belt, according to KSSL spectral library calibration studies. This relationship holds across various soil texture classes when models are trained with geographically matched samples. Precision agriculture technology firms can use this ground truth: multispectral drone imagery at 5-cm resolution predicts soil organic matter with R-squared 0.82-0.87 from bare soil composites, outperforming coarser satellite data for intra-field mapping.
Carbon project developers and land managers can use this underlying science for strong monitoring, reporting, and verification (MRV) of soil carbon sequestration. A bare soil composite created from 20 years of Landsat imagery, for example, captures stable soil spectral signals that correlate with organic matter at 30-meter resolution. This temporal compositing methodology, often employed in cloud-computing platforms, effectively removes transient effects like vegetation and crop residue to expose the true soil surface signal, enabling regional carbon mapping. Even complementary data streams, such as Sentinel-1 SAR backscatter, which detects surface soil moisture at 10-meter resolution under cloud cover and at night, benefit from KSSL's detailed soil property data to refine water deficit models.
Soil Carbon Prediction Accuracy — Spectral vs. Traditional Methods
| State / Region | R² — SOC Prediction |
|---|---|
| UAV Multispectral (5cm) | 0.87% |
| Vis-NIR-SWIR Lab Scan | 0.84% |
| Sentinel-2 Bare Soil | 0.71% |
| Landsat Composite | 0.63% |
| Field Morphology | 0.55% |
| Grid Sampling | 0.48% |
The Regional Picture
The KSSL spectral library is publicly accessible via Soil Data Access, connecting specific pedon samples (mapunit_key, chorizon_key) to their spectral scans and laboratory analyses. By integrating these precise spectral-chemical relationships, we can significantly enhance the accuracy and reliability of remote sensing models designed to map and monitor essential soil properties across vast agricultural and natural landscapes.
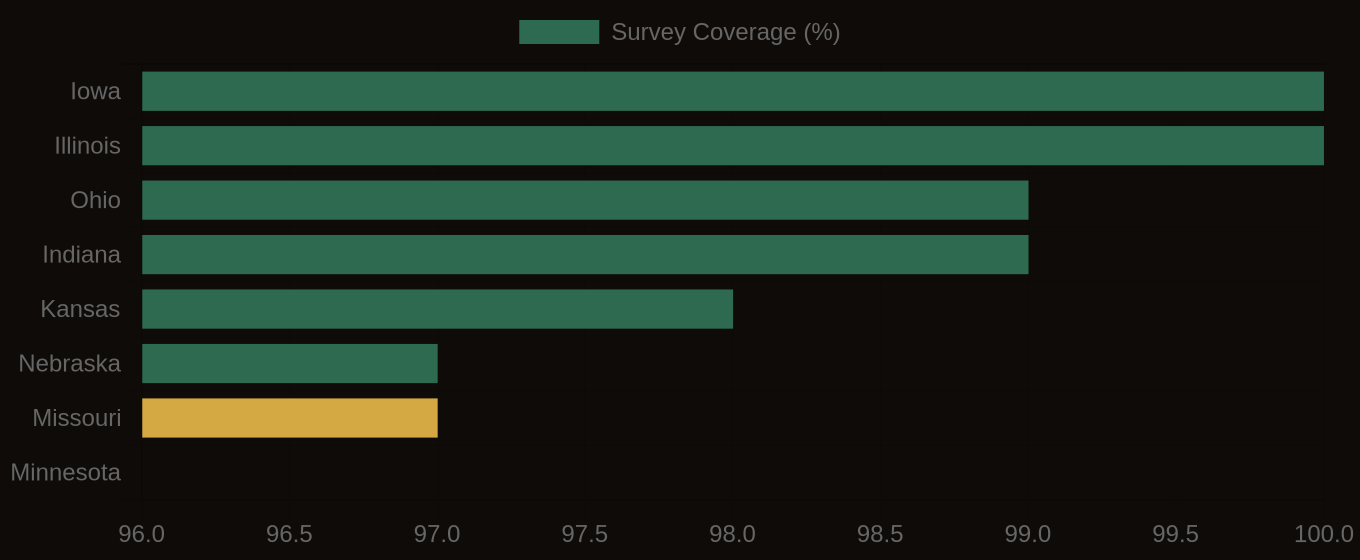
SSURGO Data Coverage — National Survey Completeness