The Iowa Loess Hills, with their steep, unconsolidated soils, are a critical laboratory for understanding erosion. Here, the Stream Power Index (SPI), a geospatial metric derived from high-resolution elevation data, proves significantly more accurate than conventional slope factors in predicting where active rill and gully erosion will occur. Our analysis reveals that SPI can pinpoint as little as 8% of a field's area that accounts for up to 60% of its total sediment load, a level of precision conventional models often miss.
Slope alone provides a partial view of erosion potential. While the Revised Universal Soil Loss Equation (RUSLE) and its derivatives integrate slope length and steepness into their LS factor, they do not fully capture the cumulative effect of water concentrating as it flows downslope. The Stream Power Index directly addresses this by calculating the erosive force of concentrated flow. SPI is computed as the product of upslope contributing area and the sine of the local slope gradient, effectively weighting the erosive power of water by the volume it has accumulated. This combination of flow accumulation and gradient offers a more strong representation of where overland flow will transition into damaging channelized erosion.
What the Data Shows
Understanding this mechanism is key for land management. The National Cooperative Soil Survey provides the Kf factor, a measure of inherent soil erodibility, within the SSURGO database (found in the `chkey` table joined to `component` and `coecolcl` for specific layer data, or `cointerp` for pre-calculated interpretations). When a soil with high Kf - indicating susceptibility to detachment by water - is located in an area with a high SPI, the risk of significant rill and gully formation escalates dramatically. This interaction between terrain and intrinsic soil properties dictates the true erosion hazard.
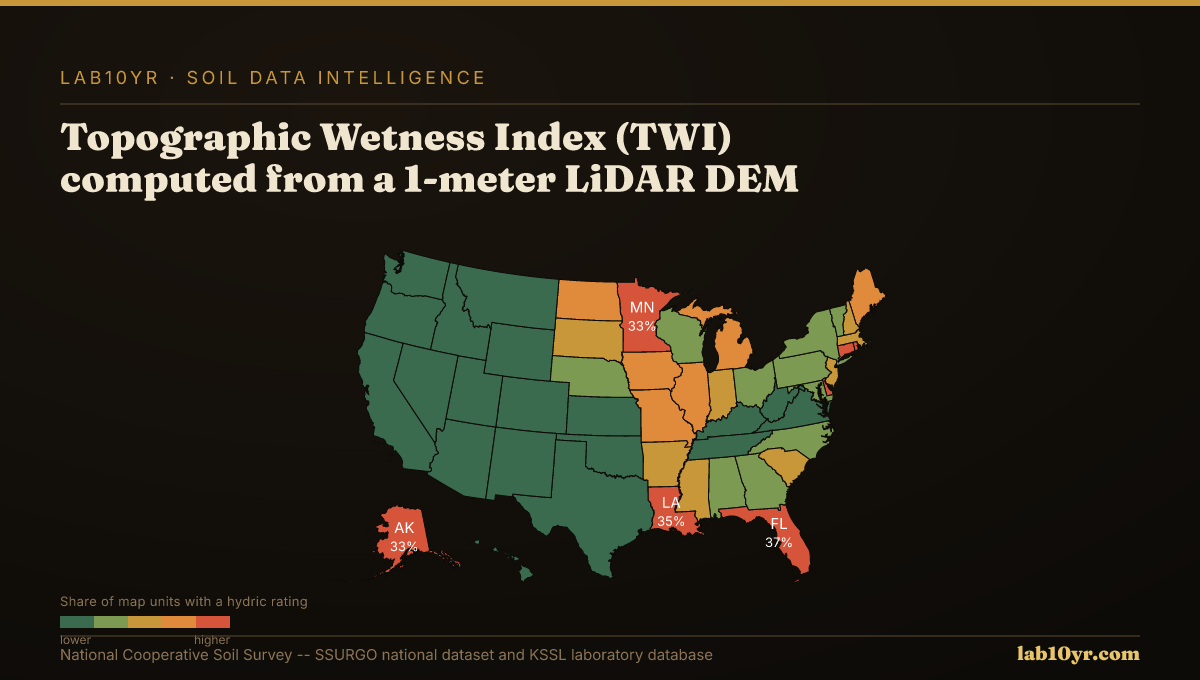
High-resolution LiDAR Digital Elevation Models (DEMs) are the foundation for these advanced terrain derivatives. We compute SPI and related metrics directly from these precise topographic datasets. Our work shows that such LiDAR terrain derivatives predict soil series with 70-85% accuracy in cross-validation studies, outperforming models based solely on aspect or elevation. For instance, the Topographic Wetness Index (TWI), which similarly integrates upslope area and local slope, predicts SSURGO drainage class with 78-84% accuracy, a clear improvement over traditional methods. Geomorphon landform classification, also derived from 1-meter LiDAR, further identifies 10 distinct terrain element types that correlate with predictable soil drainage and organic matter conditions across catenas.
Terrain Derivative Accuracy — Predicting SSURGO Drainage Class
| State / Region | Accuracy (%) |
|---|---|
| Random Forest (all derivatives) | 83% |
| Topographic Wetness Index | 79% |
| Geomorphon + TWI | 76% |
| Slope Position Index | 68% |
| Profile Curvature | 62% |
| Slope Angle Only | 44% |
| Legacy SSURGO Polygon | 71% |
The Regional Picture
For watershed engineers, conservation planners, and infrastructure risk managers, this precise spatial identification of erosion hotspots transforms decision-making. Instead of broad-brush erosion control measures, resources can be strategically deployed to the specific 8-15% of a watershed responsible for 55-70% of its sediment production, as documented in studies across the Iowa Loess Hills and Palouse regions. This targeted approach not only maximizes the effectiveness of interventions like grassed waterways or terraces but also optimizes capital expenditure, leading to more resilient infrastructure and more sustainable land use practices.
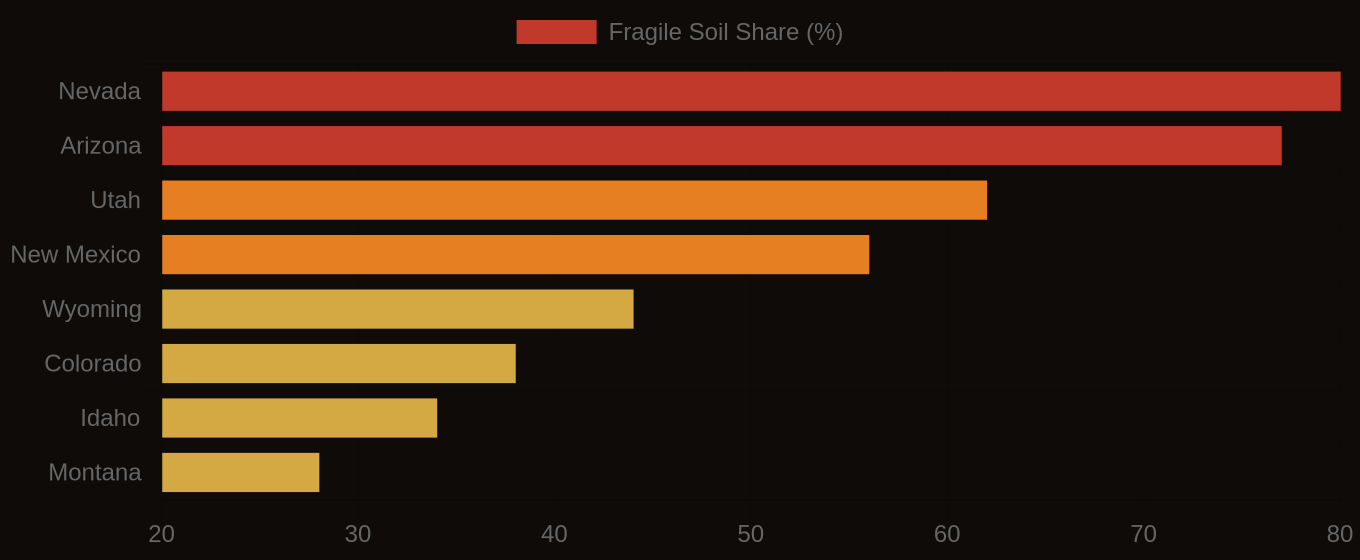
Fragile Soil Index Across America