In the Iowa Loess Hills, the Stream Power Index (SPI), computed from upslope contributing area and local slope gradient, precisely isolates the 8% of field area that generates 60% of the sediment load, offering a far more accurate erosion prediction than slope gradient alone. This capability transforms how professionals identify, quantify, and manage active erosion.
Stream Power Index (SPI) quantifies the erosive energy of concentrated water flow across a landscape. It is calculated as the product of upslope contributing area and the sine of the local slope gradient. While generalized erosion models like the Revised Universal Soil Loss Equation (RUSLE) utilize slope as a factor for estimating sheet erosion, SPI specifically targets concentrated flow paths. These are the channels where water accumulates volume and velocity, initiating rill and gully erosion. Rills are small, ephemeral channels formed by concentrated runoff; gullies are larger, more permanent incisions that dissect fields and shed significant sediment. SPI effectively maps these critical zones where the interaction of water volume and slope maximizes erosive potential.
What the Data Shows
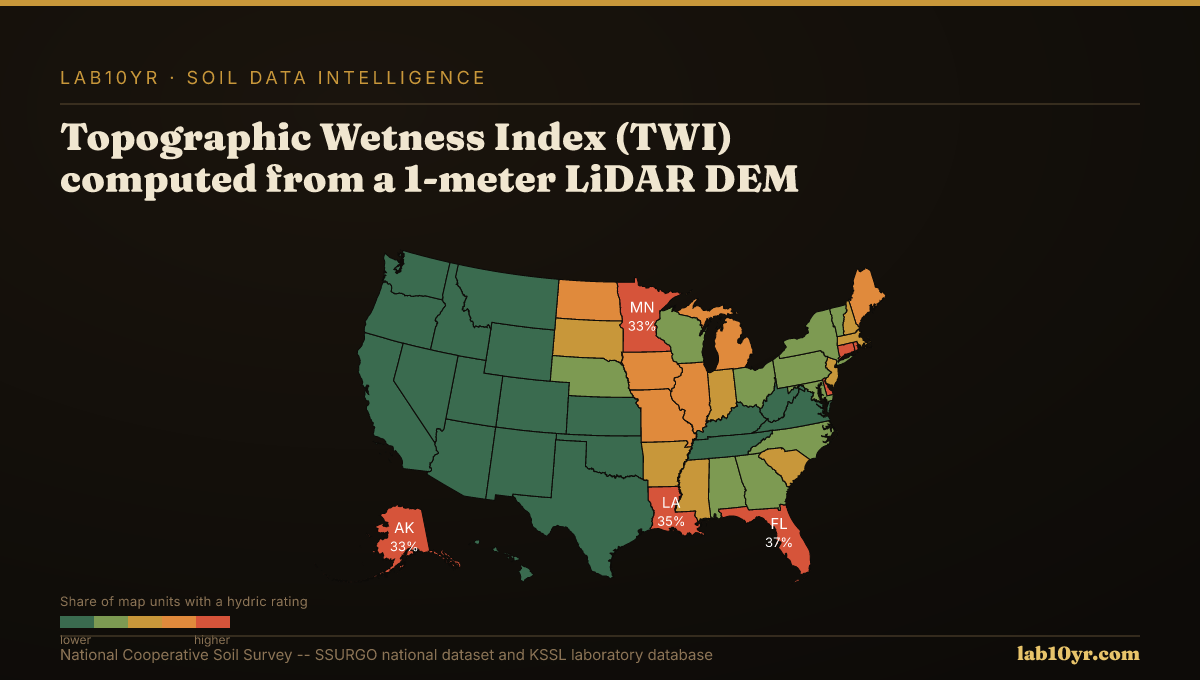
Derived from high-resolution 1-meter LiDAR Digital Elevation Models (DEMs), SPI is one of several terrain derivatives that dramatically enhance our understanding of soil patterns. LiDAR-derived models capture intricate topographic features, providing the foundational input for calculating upslope area and slope gradient with high fidelity. Digital soil mapping research by the National Cooperative Soil Survey shows that such LiDAR terrain derivatives predict soil series with 70-85% accuracy in cross-validation studies. For instance, the Topographic Wetness Index (TWI), another derivative integrating upslope area and slope to quantify water accumulation potential, predicts SSURGO drainage class with 78-84% accuracy, significantly outperforming simpler metrics like aspect or elevation. These analyses confirm that terrain curvature, slope position, and multi-scale relief independently explain 45-65% of soil series variance, with their combined application in random forest models reaching 70-85% accuracy. Furthermore, geomorphon landform classification from 1-meter LiDAR identifies ten terrain element types, from summits and ridges to hollows and valleys, each corresponding to predictable soil drainage and organic matter ranges across the soil catena.
For watershed engineers and conservation planners, this precision means moving beyond generalized erosion risk assessments based on broad slope categories. SPI allows the precise identification of erosion 'hot spots,' ensuring that limited conservation resources are directed to the 8-15% of watershed area often responsible for 55-70% of measured sediment production, as observed in critical regions like the Iowa Loess Hills and the Palouse. Infrastructure risk managers can utilize these insights to prioritize culvert sizing, design more resilient road crossings, and plan effective right-of-way stabilization projects, mitigating unexpected failures. Precision agriculture consultants can optimize variable-rate cover cropping, contour tillage, or grassed waterway placement specifically within these identified flow channels, preventing costly soil loss, nutrient runoff, and maintaining field productivity.
Terrain Derivative Accuracy — Predicting SSURGO Drainage Class
| State / Region | Accuracy (%) |
|---|---|
| Random Forest (all derivatives) | 83% |
| Topographic Wetness Index | 79% |
| Geomorphon + TWI | 76% |
| Slope Position Index | 68% |
| Profile Curvature | 62% |
| Slope Angle Only | 44% |
| Legacy SSURGO Polygon | 71% |
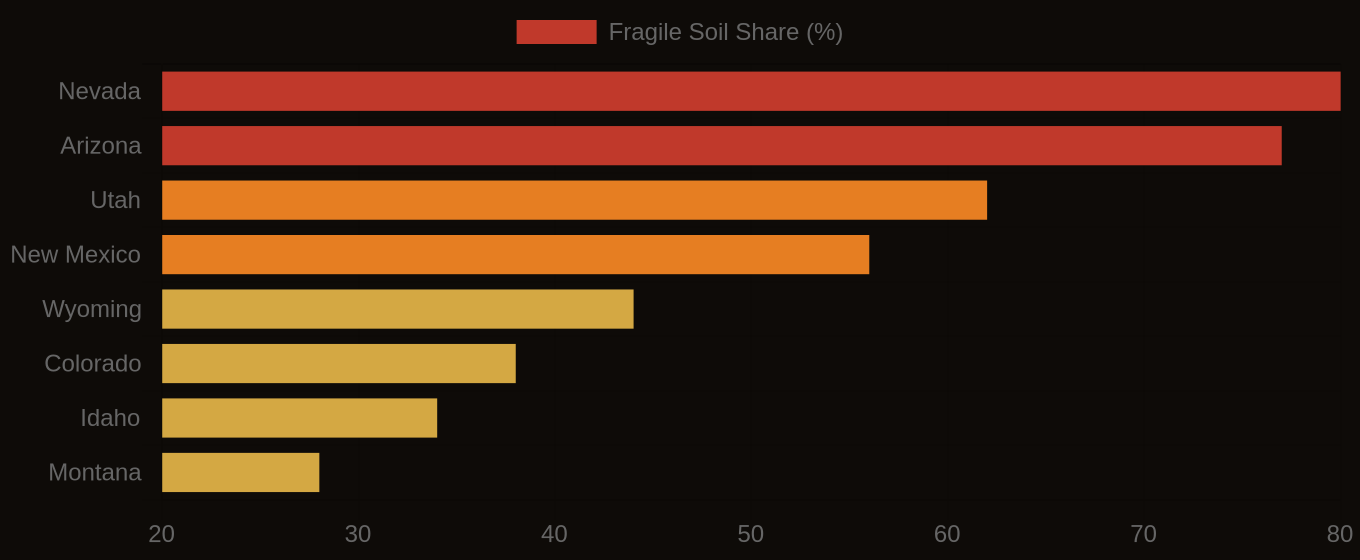
The Regional Picture
Integrating high-resolution terrain data with SSURGO soil properties provides an unparalleled view of active geomorphic processes, transforming how we manage land and mitigate environmental risks across diverse landscapes.
Fragile Soil Index Across America