In the Iowa Loess Hills, the Stream Power Index, a terrain derivative calculated from upslope contributing area and slope gradient, pinpoints active rill and gully erosion with significantly higher spatial accuracy than slope gradient alone. This distinction is critical: SPI can isolate as little as 8% of a field's area that accounts for a disproportionate 60% of its total sediment load, offering a precise map for intervention. Unlike generalized erosion models, SPI directly quantifies the erosive force of concentrated water flow, which is the primary driver of catastrophic gully formation.
Stream Power Index (SPI) is derived from fundamental geomorphic principles, computed as the product of the upslope contributing area and the sine of the local slope angle. This formula captures the direct relationship between the volume of water concentrating in a flow path and the gradient over which it travels. As water accumulates from an increasing upslope area, its erosive potential grows; as the terrain steepens, its velocity and capacity to detach and transport soil particles intensify. High-resolution 1-meter LiDAR Digital Elevation Models (DEMs) are indispensable for accurate SPI computation, enabling the precise mapping of convergent flow paths and their associated erosion risk. Within these high-power zones, the inherent erodibility of a soil, quantified by its SSURGO Kf factor-a dimensionless value representing a soil's susceptibility to detachment by water-is fully expressed, leading to maximum sediment production.
What the Data Shows
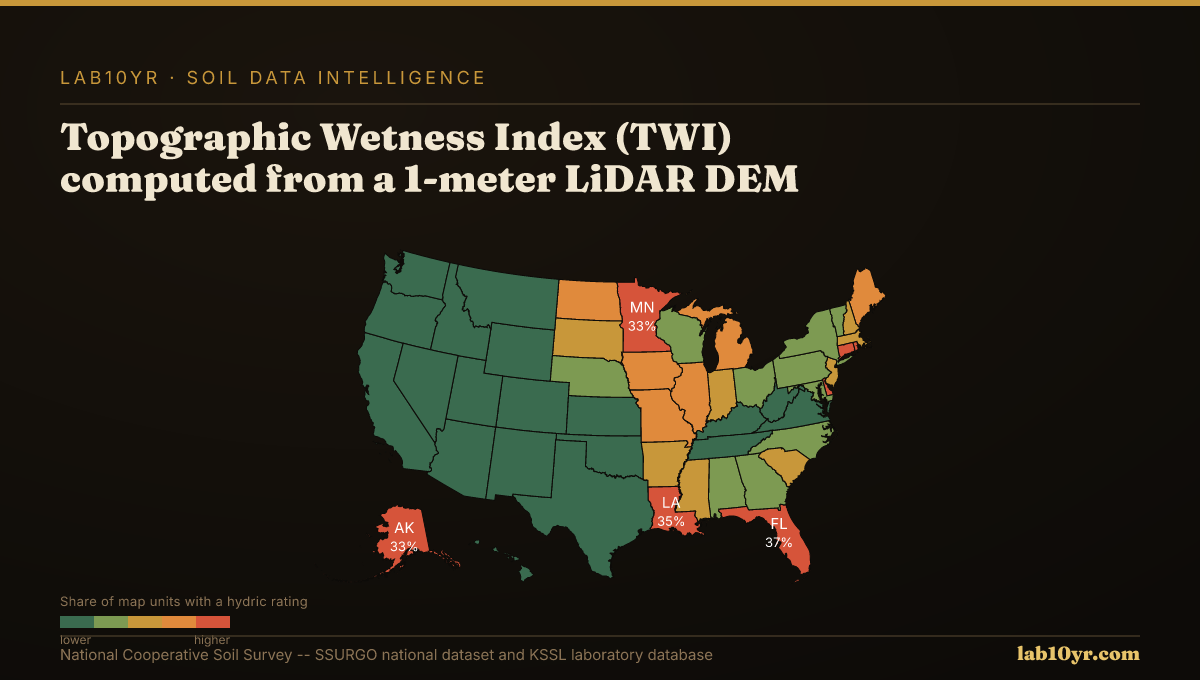
For watershed engineers, conservation planners, and infrastructure risk managers, identifying these high-SPI zones is major. This targeted data allows for the strategic deployment of resources to the precise 8-15% of watershed area responsible for 55-70% of measured sediment production, as observed in diverse settings from the Iowa Loess Hills to the Palouse region. Such precision minimizes the cost of interventions like terracing or constructing grassed waterways, while maximizing their efficacy in mitigating sediment runoff and improving water quality. This advanced terrain analysis extends beyond SPI: LiDAR terrain derivatives generally improve our understanding of soil patterns. Cross-validation studies indicate that combined terrain attributes, including curvature, slope position, and Topographic Wetness Index (TWI), predict soil series with 70-85% accuracy. TWI, for instance, which integrates upslope area and local slope to quantify water accumulation, predicts SSURGO drainage class with 78-84% accuracy, consistently outperforming predictions based on aspect or elevation alone. These findings highlight the superior diagnostic capability of high-resolution terrain analysis in informing critical land management and planning decisions.
Terrain Derivative Accuracy — Predicting SSURGO Drainage Class
| State / Region | Accuracy (%) |
|---|---|
| Random Forest (all derivatives) | 83% |
| Topographic Wetness Index | 79% |
| Geomorphon + TWI | 76% |
| Slope Position Index | 68% |
| Profile Curvature | 62% |
| Slope Angle Only | 44% |
| Legacy SSURGO Polygon | 71% |
The Regional Picture
Fragile Soil Index Across America