Sentinel-1 synthetic aperture radar (SAR) backscatter at 10-meter resolution captures surface soil moisture under cloud cover, at night, and in active rain events. Fields with SSURGO available water capacity below 0.12 cm/cm show SAR-detected stress signatures 4-7 days before yield loss becomes visible in multispectral imagery. This early detection capability changes how precision agriculture managers approach irrigation and how crop insurance actuaries assess risk.
Unlike optical remote sensing, which relies on reflected sunlight, SAR sends out its own microwave pulses and records the signal that scatters back from the Earth's surface. C-band SAR, like that from ESA's Sentinel-1 satellites, is sensitive to the volumetric water content in the top 5 cm of soil. Wet soil, for instance, results in lower backscatter values, providing a direct measurement of surface moisture. This physical principle allows for continuous detection of moisture deficits regardless of cloud cover, smoke, or time of day. When these real-time SAR observations are combined with existing SSURGO data on Available Water Capacity (AWC), the picture becomes remarkably clear. AWC, expressed in cm/cm, quantifies the volume of water held by a soil between field capacity and permanent wilting point, representing the water truly accessible to plants. SSURGO provides this essential property at various depths.
What the Data Shows
Optical remote sensing, while limited by atmospheric conditions, excels in other areas of soil characterization. Bare soil Vis-NIR-SWIR reflectance predicts soil organic carbon with R-squared 0.75-0.88 in the Corn Belt, according to KSSL spectral library calibration studies. The Kellogg Soil Survey Laboratory (KSSL) spectral library contains over 50,000 Vis-NIR-SWIR scans of soil samples with matched laboratory chemistry measurements, making it the largest publicly available soil spectral dataset globally. Multispectral drone imagery, operating at 5-cm resolution, predicts soil organic matter with R-squared 0.82-0.87 from bare soil composites derived after harvest or tillage, often outperforming satellite imagery for detailed intra-field mapping. A bare soil composite from 20 years of Landsat imagery captures stable soil spectral signals correlating with organic matter at 30-meter resolution, a methodology from Google Earth Engine analysis.
However, these optical methods depend on clear skies and specific bare soil windows, making them unsuitable for continuous soil moisture tracking during critical growth periods. For irrigation engineers, SAR data refines water application schedules, reducing water waste and optimizing yields. Crop insurance actuaries gain an objective, early indicator of drought stress, allowing for more accurate risk modeling and facilitating timely claims adjustment. Climate researchers also benefit, using SAR to monitor regional drying trends and validate hydrological models. This integration of radar physics and established soil data provides a clearer, more timely picture of agricultural water status across diverse environmental conditions.
Soil Carbon Prediction Accuracy — Spectral vs. Traditional Methods
| State / Region | R² — SOC Prediction |
|---|---|
| UAV Multispectral (5cm) | 0.87% |
| Vis-NIR-SWIR Lab Scan | 0.84% |
| Sentinel-2 Bare Soil | 0.71% |
| Landsat Composite | 0.63% |
| Field Morphology | 0.55% |
| Grid Sampling | 0.48% |
The Regional Picture
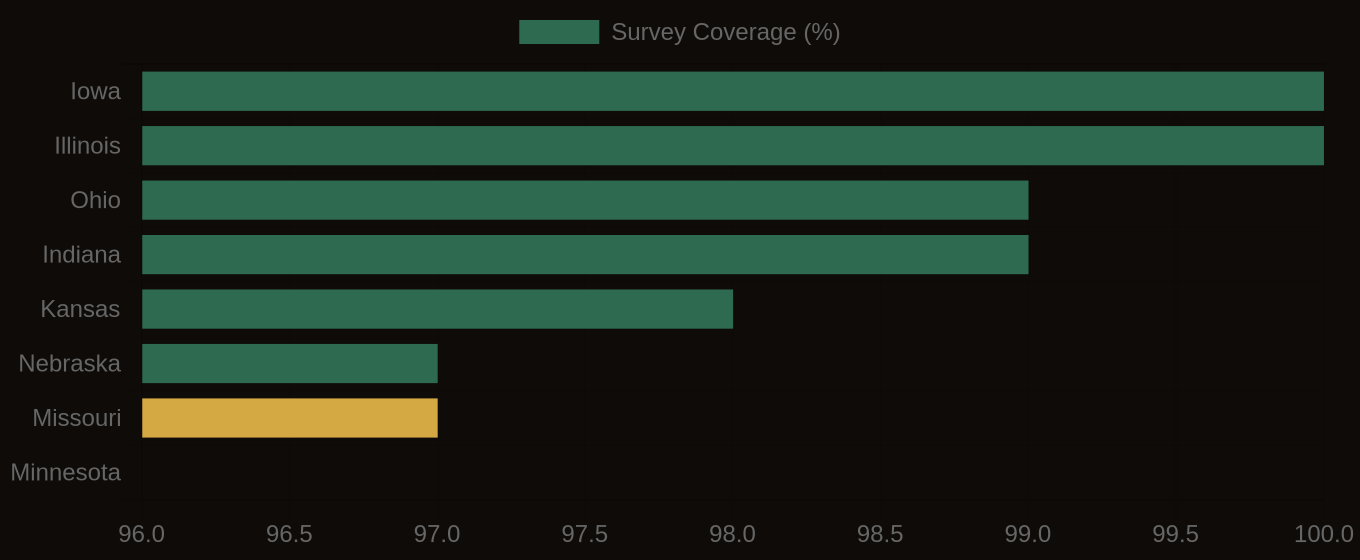
SSURGO Data Coverage — National Survey Completeness