Sentinel-1 Synthetic Aperture Radar (SAR) backscatter, delivering 10-meter resolution data, penetrates cloud cover, operates at night, and captures surface soil moisture even during active rain events. This unique capability reveals crop water stress signatures 4 to 7 days before yield loss becomes evident in traditional multispectral imagery, especially in fields where SSURGO available water capacity (AWC) falls below 0.12 cm/cm.
Unlike optical sensors, which rely on reflected sunlight and are blocked by clouds or darkness, SAR actively transmits microwave pulses and measures the energy that bounces back, known as backscatter. C-band SAR, like that on Sentinel-1, is particularly sensitive to the volumetric water content in the top 5 centimeters of soil. Higher soil moisture increases backscatter intensity, providing a direct measurement of surface wetness. This penetration ability ensures continuous monitoring regardless of weather or time of day, a critical advantage for precision agriculture and drought monitoring, as confirmed by ESA Sentinel-1 soil moisture studies.
What the Data Shows
The connection between SAR-detected moisture and a field's inherent Available Water Capacity (AWC) is key. AWC, a key interpretation from the National Cooperative Soil Survey, quantifies the volume of water soil can hold for plant use between field capacity (the maximum water a soil can hold against gravity) and wilting point (the minimum water a plant can extract). Fields with inherently low AWC deplete their water reserves more quickly. When SAR detects falling surface moisture in these low-AWC areas, it signals impending deeper root zone stress, often days before plant physiological changes are large enough to alter the reflectance patterns seen by multispectral sensors.
While SAR excels at moisture detection, optical sensors provide vital information on vegetation health and soil organic matter. Bare soil visible-near-infrared-shortwave infrared (Vis-NIR-SWIR) reflectance, for example, predicts soil organic carbon with R-squared values between 0.75 and 0.88 in the Corn Belt. This relies on extensive calibration using spectral libraries like the Kellogg Soil Survey Laboratory (KSSL) database, which holds Vis-NIR-SWIR scans for over 50,000 soil samples matched with laboratory chemistry measurements. Multispectral drone imagery, at resolutions as fine as 5 centimeters, can use these calibrations to map intra-field organic matter with R-squared values from 0.82 to 0.87 from bare soil composites, outperforming most satellite imagery for this specific task.
Soil Carbon Prediction Accuracy — Spectral vs. Traditional Methods
| State / Region | R² — SOC Prediction |
|---|---|
| UAV Multispectral (5cm) | 0.87% |
| Vis-NIR-SWIR Lab Scan | 0.84% |
| Sentinel-2 Bare Soil | 0.71% |
| Landsat Composite | 0.63% |
| Field Morphology | 0.55% |
| Grid Sampling | 0.48% |
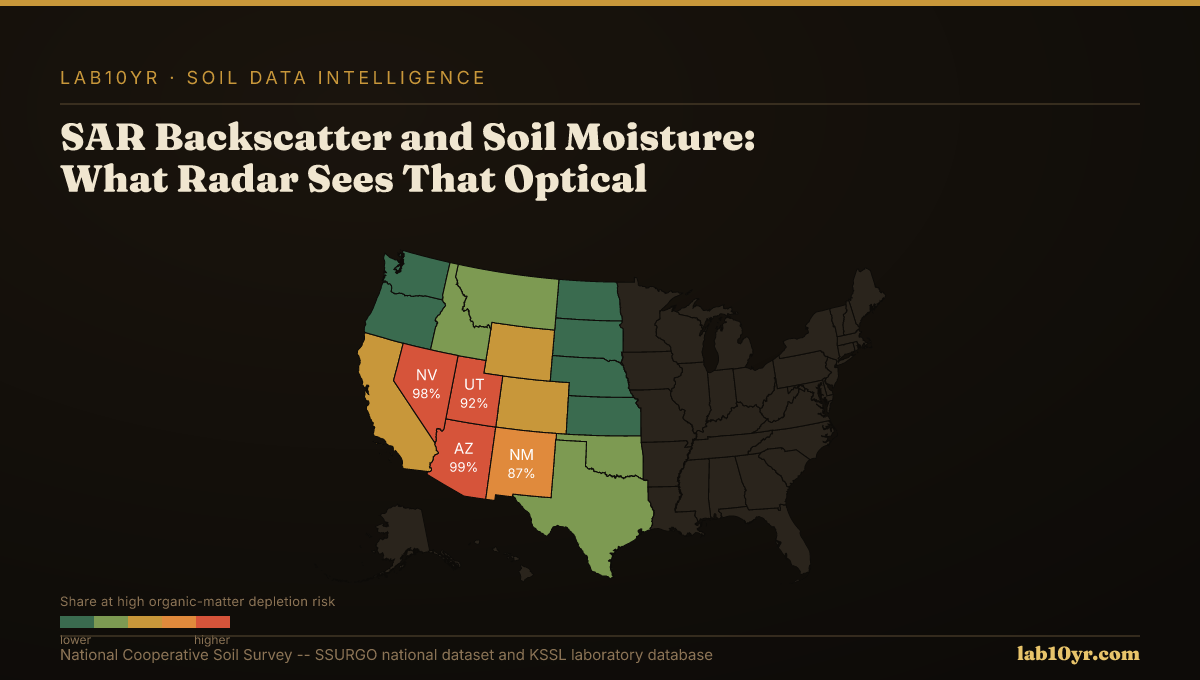
The Regional Picture
For irrigation engineers, crop insurers, and farm managers, the early warning from SAR-detected moisture deficit in low-AWC soils translates directly into proactive decision-making. It allows for optimized irrigation scheduling, reducing water waste and energy costs. Actuaries gain a more reliable, cloud-penetrating metric for assessing drought risk and validating claims, moving beyond reliance on visible signs of damage. By integrating Sentinel-1 SAR data with SSURGO AWC and KSSL-calibrated optical analyses, we provide a holistic view of water availability and plant response, enabling more resilient agricultural practices.
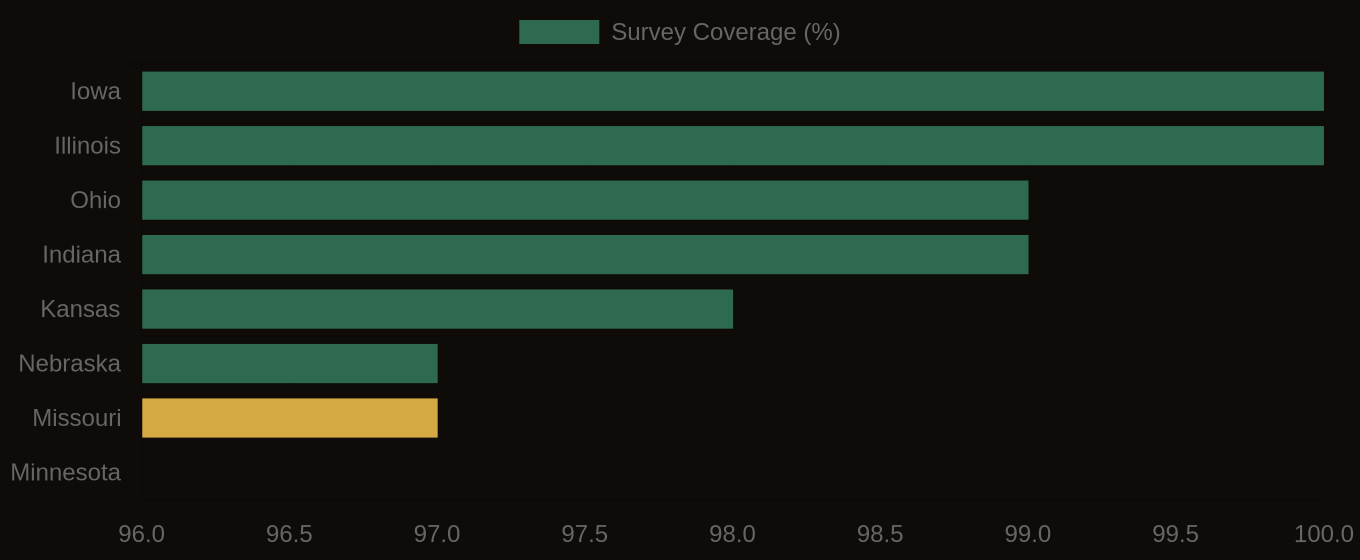
SSURGO Data Coverage — National Survey Completeness