Random forest models trained on LiDAR terrain derivatives, climate rasters, and parent material data are predicting soil series with 72-88% accuracy in cross-validation. In the Rocky Mountain states, these machine learning models demonstrably outperform legacy polygon maps derived from 1960s field traverses. This advancement, known as digital soil mapping (DSM), fundamentally reshapes how we understand and apply soil information for critical land management and planning decisions. It provides significantly higher spatial resolution and precision than traditional methods.
Digital soil mapping uses the predictive power of environmental covariates, measurable characteristics of the landscape influencing soil formation. Terrain derivatives, extracted from high-resolution LiDAR data, include factors like slope, aspect, and the topographic wetness index. These directly reflect the relief factor in soil formation, dictating water flow, erosion patterns, and microclimates. Machine learning algorithms, particularly random forest, learn complex, non-linear relationships between these covariates and known soil properties or series identified in the field or from laboratory analyses, such as those within the KSSL database.
What the Data Shows
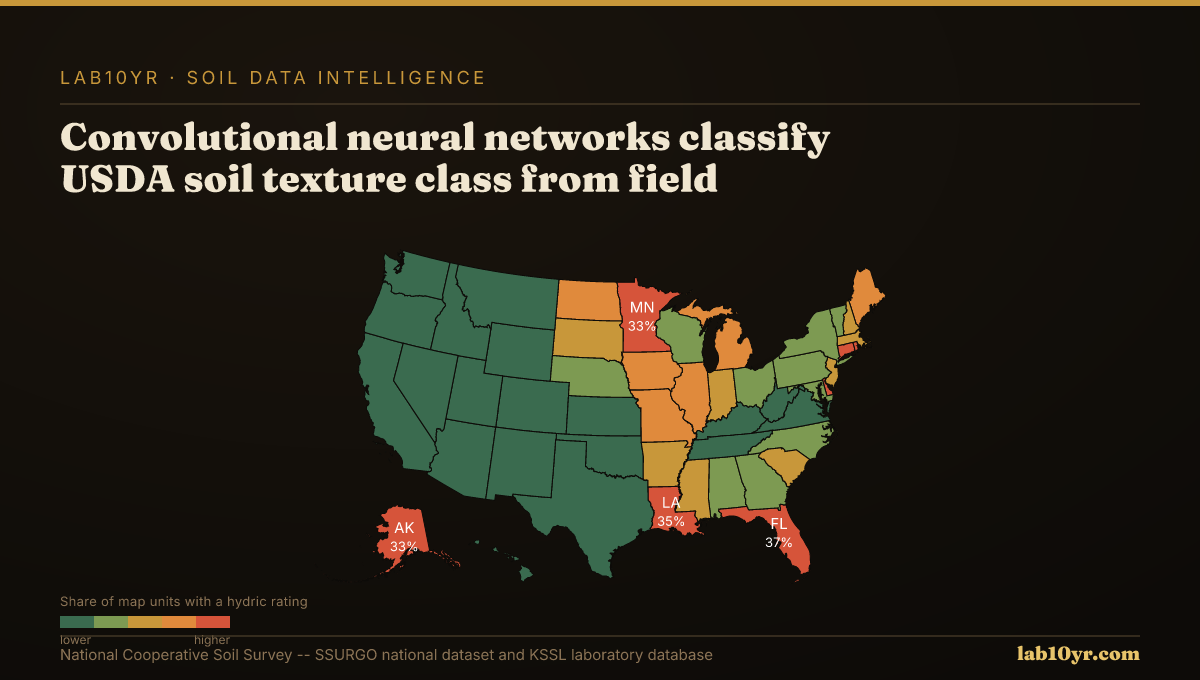
Beyond terrain, other machine learning approaches refine specific soil properties. Convolutional neural networks, for instance, classify the National Cooperative Soil Survey soil texture class from field profile photographs with 74-81% accuracy, competing directly with traditional field morphological assessment. Soil texture, the proportion of sand, silt, and clay, dictates water holding capacity, nutrient retention, and permeability. Object-based image analysis (OBIA) of high-resolution aerial imagery delineates soil surface units that match SSURGO map unit boundaries with 73-79% accuracy. This technique segments imagery into meaningful objects, classifying surface characteristics like color and moisture.
Expanding further, deep learning models trained on Sentinel-2 multispectral time series predict soil drainage class with 71% overall accuracy nationally. This relies on the temporal phenology signal, where vegetation response to soil wetness or dryness creates a detectable signature. The efficiency of these models is also improving; transfer learning from ImageNet reduces required training samples for soil texture classification by 60-75%, accelerating model development. Automated soil color extraction from standardized field photos achieves Munsell hue classification accuracy of 82% without a physical color chart, providing automated insights into organic matter and drainage.
Terrain Derivative Accuracy — Predicting SSURGO Drainage Class
| State / Region | Accuracy (%) |
|---|---|
| Random Forest (all derivatives) | 83% |
| Topographic Wetness Index | 79% |
| Geomorphon + TWI | 76% |
| Slope Position Index | 68% |
| Profile Curvature | 62% |
| Slope Angle Only | 44% |
| Legacy SSURGO Polygon | 71% |
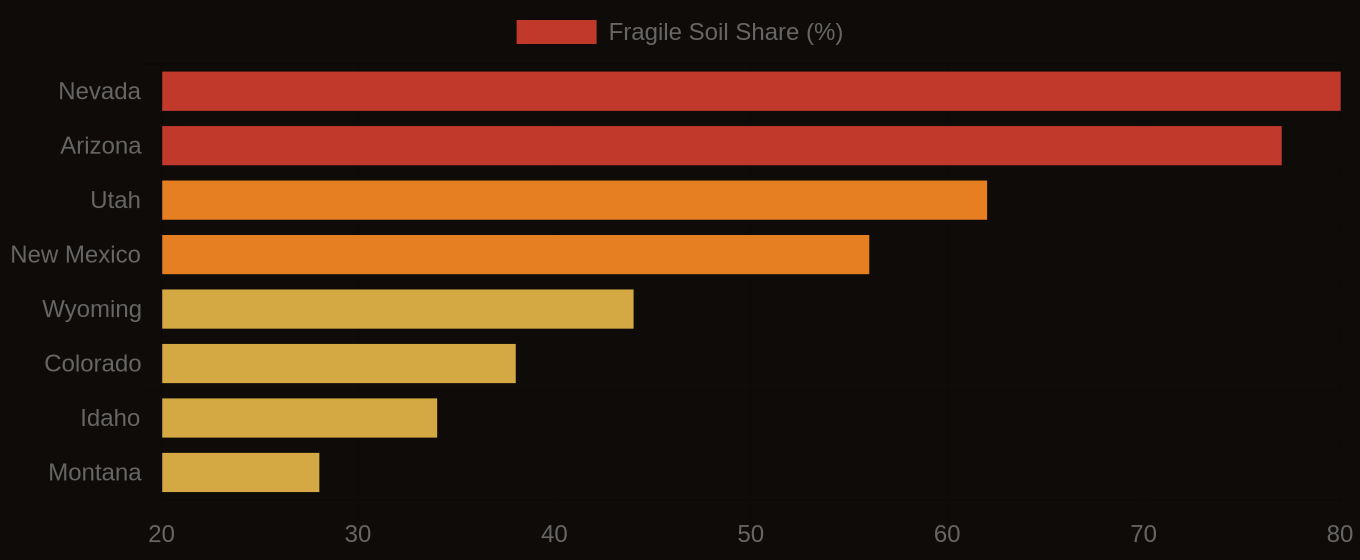
The Regional Picture
These advances mean a major shift for engineers, lenders, and land managers. Instead of relying on broad, often generalized polygon delineations, professionals can access high-resolution raster maps of soil properties, predicting conditions at resolutions far finer than traditional surveys. This granular data enables more precise risk assessments for infrastructure, optimized nutrient management in agriculture, and more accurate environmental impact assessments. The National Cooperative Soil Survey's foundational data, including SSURGO and KSSL, remains the indispensable ground truth for training and validating these next-generation digital soil products.
Fragile Soil Index Across America